The Income Machine: Getting Paid Twice Without Betting the Principal
July 1, 2026 - the July screen is live, and the setup is unusually generous.
June taught the expensive lesson: when the machines delever, seven flavors of "diversified" equity fall on the same candle, and only cash, defensives, and rent-paying assets keep their footing. This month we do something with that lesson. We stop asking the market to be kind and start making it pay us - twice - for holding assets it has temporarily mispriced. That is the entire idea behind DIVIDOND's July issue: build an income machine on a small, disciplined sleeve of capital, wring two paychecks out of every position, and refuse to let the principal that generates those paychecks get chewed up in the process.
Let me be blunt about the mandate, because it shapes every name on this month's list. We are running a $5,000 to $10,000 income sleeve. The goal is an aggressive monthly payout - real cash pulled in, not paper gains you hope to sell later. But the constraint sits above the goal: the principal cannot be eroded. That single rule disqualifies most of the double-digit yields you will see quoted on other sites, and it is exactly why those sites hand you a ticker and we hand you a structure.
Two paychecks from one position
Here is the mechanic that separates income investing from yield chasing. When you own 100 shares of a quality dividend payer that has been knocked down on sentiment - not on a broken business - you can collect the dividend and sell a covered call against the same shares. The dividend is the first paycheck. The call premium is the second. If the stock drifts sideways or grinds higher into your strike, you keep both, and you do it again next month. The market pays you to be patient, and then pays you again to cap upside you were not counting on anyway.
The reason this works right now is that June's liquidation left a specific residue: good companies with beaten-down prices and, crucially, elevated option premiums. Fear is still priced into the chains. When implied volatility is rich, the covered call you sell is worth more - the second paycheck is fatter. That is the window. It does not stay open forever, which is why this is a July issue and not an evergreen page.
"A dividend tells you the business pays. A covered call tells you the crowd is scared. Stack them and you get paid for both."
The rule that protects the principal
Aggressive income and principal protection sound like opposites. They are not - if you are disciplined about three things.
First, the underlying has to be a business you would hold anyway. We only sell calls against names with durable cash flow, sustainable payout ratios, and a reason the recent weakness is sentiment rather than rot. A covered call on a falling knife is just a slower way to lose money. Second, the premium is a buffer, not a bonus. Every dollar of call premium and every dollar of dividend lowers your effective cost basis, which means the stock can slip a little and you are still whole. On a beaten-down name near support, that buffer is often the difference between a red month and a flat-but-paid month. Third - and this is the discipline most people skip - we do not carry trading risk over the weekend. Income that is meant to be captured gets captured in the current week. Gaps happen on Mondays; we would rather be flat and paid than exposed and hopeful.
Those three rules are why our list is short and why some of the juiciest headline yields are on our "do not touch" pile, not our buy pile.
Bucket A - what you can capture this week
The first bucket is pure dividend capture on names going ex-dividend in the current window, chosen for principal stability rather than the fattest yield. The standout is General Mills (GIS): a 6.5% yield, an ex-dividend date of July 10, a payout ratio near 59%, and a price-to-earnings ratio around 9 - cheap, covered, and defensive, with a deep, liquid options market that lets you layer a call on top if you want the second paycheck. Sysco (SYY) goes ex-dividend July 2, the most immediate capture on the board, with a ~60% payout and the boring, sticky cash flow of food distribution. Dollar General (DG) rounds out the bucket with a very safe 33% payout and an ex-date of July 7 - a lower headline yield, but the kind of low-payout name where the dividend is the least of your worries.
Bucket B - the double-income desk
This is where June's fear becomes July's premium. These are quality names beaten down on sentiment, with liquid options and enough implied volatility to make the covered call worth writing. Target (TGT) is the textbook case: a discount retailer the crowd has left for dead, a 3.6% dividend, and one of the most liquid option chains on the screen - sell strength, collect premium, keep the dividend. Starbucks (SBUX) carries a turnaround narrative and the richest implied volatility in the group, which means the fattest second paycheck. Williams (WMB) offers the single most liquid options market on the board and a pipeline business that throws off steady cash. CVS Health (CVS) is the deep-value healthcare bounce - heavy option volume and premium priced well above its own recent realized volatility - though we flag its stretched payout as a reason to treat it as an options-income trade, not a buy-and-forget hold.
Bucket C - the six-to-twelve-month payers
Not every dollar should be traded weekly. The third bucket is for capital that wants to sit and collect a real yield for two to four quarters, and our rule here is simple: a yield above 5% with a payout the business can actually sustain. Altria (MO) leads it - a 5.9% yield backed by a 47% operating margin and the kind of cash generation that funds dividends through almost any tape. Best Buy (BBY) pairs a 5.1% yield with a conservative ~54% payout and a single-digit-teens P/E, a name you can hold and overwrite with calls. Enbridge (ENB) gives a 5.3% pipeline yield; its headline payout looks high on a GAAP basis, but the distribution is covered on the cash-flow measures that matter for midstream, so we keep it as a longer hold with eyes open.
The yield we will not touch
Discipline is mostly a list of "no." This month's temptations - and passes - include Frontline (FRO) at a headline 17.7%, which is a variable shipping payout that can be cut in half without warning; Robert Half (RHI) at 7.2% with a payout above 130%; Amcor (AMCR) at 5.9% with a payout near 175%; and even UPS at 6.0% with a payout over 100%. Each of these pays a yield that the current earnings do not fully cover. On a page whose first rule is "do not erode the principal," a dividend you are quietly funding out of the share price is not income - it is a slow refund of your own money. We would rather earn a covered 6.5% than reach for an uncovered 17.7%.
Why we aim at roughly 20%
The math behind the mandate is a tax problem as much as a market one. For an investor in the 35% bracket, covered-call premium and short-term dividend-capture gains are taxed as ordinary income. To keep something meaningful after the government's cut, a target near 20% pre-tax is not greed - it is arithmetic: roughly 20% gross, taxed at 35%, leaves about 13% in your pocket. Stacking a covered call's monthly premium on top of a captured dividend, repeated on a disciplined cadence, is one of the few structures that can realistically aim at that hurdle on a small sleeve without leverage or lottery tickets. The exact strikes, the position sizing, the ex-dividend assignment traps, and the month-by-month payout model live in the subscriber note - because those are the details that decide whether the machine actually clears the hurdle or just looks like it should.
The takeaway
June was the warning: correlated risk is not diversification, and it disappears exactly when you need it. July is the answer: own quality the crowd has mispriced, make it pay you a dividend, sell the frightened crowd a call on top, keep the premium as a buffer under your principal, and go flat before the weekend. That is not a market call. It is a design - and the design is what survives a month you did not circle on the calendar.
Passive income starts with actively paying attention. The full July screen, the covered-call setups, and the risk sizing live at www.dividond.com; the direct real estate side - modeling actual buildings and managing actual assets - lives at www.realfimodel.com.
DIVIDOND edge: use the July screener, the RISK assessment, and the covered-call playbook to separate real, capturable income from correlated risk. The book Dividends: The Twilight Zone is also available on Amazon.
Subscribe to DIVIDONDNothing here is investment advice. It is one publication's read of a live screen. Do your own work, and size your own risk.
July's 10 Ideas, In The Right Bucket
Pulled from the July 1 screen and sorted by job, not by headline yield. Bucket A is this-week dividend capture. Bucket B is covered-call "double income" on beaten-down quality. Bucket C is the 5%+ hold for capital that wants to sit and collect.
Pure Yield · Capture This Week
Cheap, covered, defensive - the flagship capture, deep options if you want a call on top.
The most immediate capture on the board - sticky food-distribution cash flow.
Lowest payout on the list - the dividend is the safest thing about it.
Double Income · Covered Call
Sentiment-hit quality with fat premium - sell strength, keep the dividend.
Richest implied vol here means the fattest second paycheck.
Steady midstream cash plus the deepest chain on the screen.
Deep-value bounce; trade it for options income, not a forever hold.
Dividend Hold · 6–12 Months, 5%+
Cash generation funds the dividend through almost any tape.
Conservative payout you can hold and overwrite with calls.
High GAAP payout, but covered on the metric midstream runs on.
On the do-not-touch pile: FRO (17.7%, variable/uncovered), RHI (7.2%, payout >130%), AMCR (5.9%, payout >175%), UPS (6.0%, payout >100%). Big numbers that the current earnings do not fully cover.
July Ex-Dividend Calendar
Straight from the July 1 screen: ticker, category, dividend, yield, payout, and ex-dividend date. Bucket tags map to the 10 ideas above.
| Company / Category | Ticker | Dividend | Yield | Payout | Ex-Dividend | Bucket |
|---|---|---|---|---|---|---|
| Food-Wholesale/Distrib | SYY | $0.55 | 2.6% | 60% | 07/02/2026 | A |
| Retail-Discount | DG | $0.59 | 2.0% | 33% | 07/07/2026 | A |
| Metal Products / Distribution | MSM | $0.87 | 2.8% | 92% | 07/08/2026 | — |
| Cellular Telecom | TIGO | $0.75 | 3.3% | 75% | 07/08/2026 | — |
| Food-Misc/Diversified | GIS | $0.61 | 6.5% | 59% | 07/10/2026 | A |
| Rental Auto/Equipment | SUNB | $0.75 | 2.0% | 89% | 07/10/2026 | — |
| Computers-Memory Devices | NTAP | $0.52 | 1.3% | 32% | 07/10/2026 | — |
| Bldg-Residential/Commer | LEN | $0.50 | 2.2% | 31% | 07/10/2026 | — |
| Medical Products | ABT | $0.63 | 2.7% | 68% | 07/15/2026 | B* |
| Cosmetics & Toiletries | CL | $0.53 | 2.3% | 81% | 07/20/2026 | — |
| Bldg & Construct Prod | OC | $0.79 | 2.0% | — | 07/20/2026 | — |
| Pharmacy Services | CVS | $0.665 | 2.6% | 117% | 07/22/2026 | B |
| Fiduciary Banks | BNY | $0.63 | 1.5% | 26% | 07/24/2026 | — |
| Electric-Integrated | LNT | $0.535 | 2.8% | 64% | 07/31/2026 | — |
B* = liquid covered-call candidate with a July ex-date. Yields, payouts, and dates are from the July 1, 2026 screen and move with price - always check the live chain before execution.
Pure Yield vs Double the Income
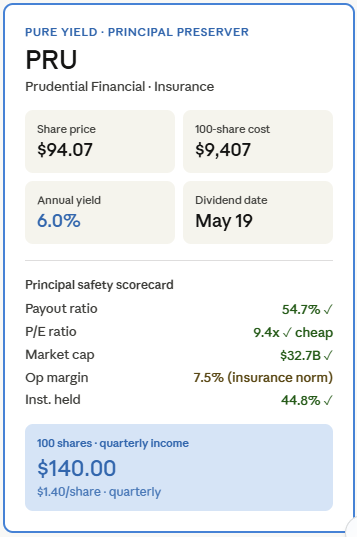
PRU
Prudential Financial anchored the pure-yield template that Bucket A builds on this month.
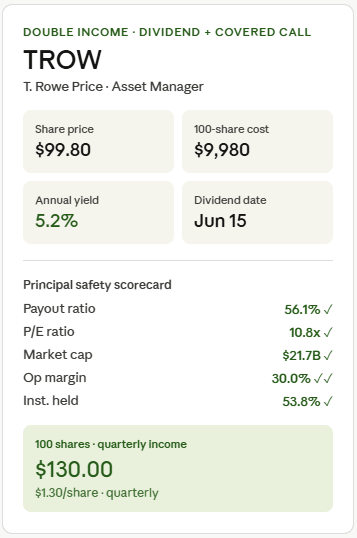
TROW
T. Rowe Price set the covered-call "double income" pattern behind Bucket B.
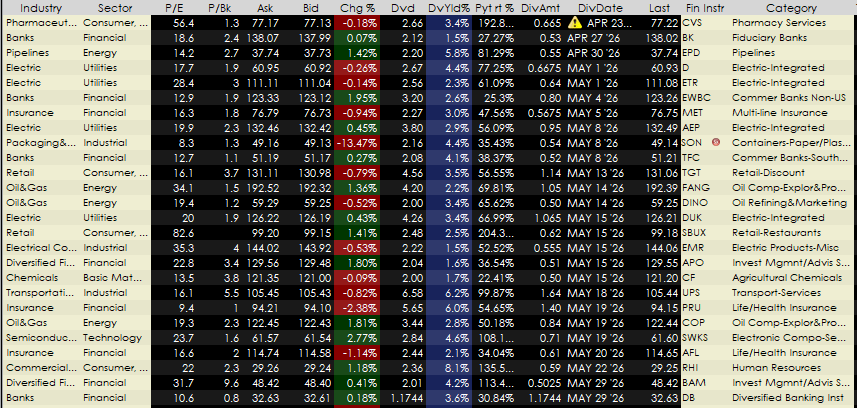
Screen Archive
The July calendar above is this month's live view. The May screen asset is preserved here as the prior-report archive with tickers, ex-dates, yields, payout ratios, P/E, P/B, and market cap.
Video Analysis
We discuss the "Twilight Zone" market mechanics and how to avoid behavioral traps.
Model Dividend Portfolio
This model illustrates how an investor might allocate capital across sectors to balance yield, growth, and survival. The right risk level is not the highest return you can imagine. It is the highest volatility you can hold without being forced into a bad sale.
For most income investors, that means a moderate risk profile: enough equity exposure to compound, enough cash and defensive yield to stay liquid, and no single theme large enough to break the plan. If the RISK profile shows preservation or stability behavior, lower the REIT, energy, and technology sleeves. If it shows opportunistic or high-conviction behavior, keep the core intact before adding satellites.
What Level of Risk Is Appropriate?
Use four checks: capacity is what you can financially survive, need is the return you actually require, tolerance is what you think you can handle, and behavior is what you actually do when markets get quiet or ugly. Behavior wins. If you overtrade during flat markets or panic in a 7% drawdown, the portfolio should be simpler, more liquid, and less concentrated.
Take the RISK Assessment| Allocation | Sector | Role | Target Yield |
|---|---|---|---|
| 20% | Utilities | Stability Anchor | 4.0% |
| 20% | Healthcare | Defensive Growth | 2.5% |
| 15% | Staples | Inflation Hedge | 3.0% |
| 15% | Technology | Dividend Growth | 1.5% |
| 10% | REITs | Income Booster | 5.0% |
| 10% | Energy | Cash Flow | 6.0% |
| 10% | Financials | Cyclical Upside | 3.5% |
Where to Invest $5,000 Now
The year-ahead retail playbook translates a large-house market view into a starter allocation: core US earnings, AI infrastructure, gold insurance, Japan reform, careful credit carry, and cash for drawdowns. For a dividend audience, the key is not chasing the biggest distribution. It is balancing cash yield with total return and after-tax durability.
| Sleeve | Ticker | Dollar | Percent | Role |
|---|---|---|---|---|
| Core | SPY or VOO | $1,500 | 30% | Earnings recovery |
| AI | SMH | $1,000 | 20% | Capex cycle |
| Insurance | IAU or GLD | $750 | 15% | Real-money hedge |
| Japan | EWJ | $750 | 15% | Structural reform |
| Carry | HYG or JEPI | $500 | 10% | Yield harvest |
| Cash | SGOV | $500 | 10% | Dry powder |
Dividend translation: JEPI can replace HYG when monthly income matters more than full upside. AMLP, EUFN, and select data-center REITs belong on the satellite watchlist after the core is funded, not before. Rebalance quarterly, trim positions more than five percentage points above target, and keep high-tax-drag income in tax-advantaged accounts when possible.
Subscribe for the full allocation noteMarket Sentiment (SUBSCRIPTION)
Pencils Down. The Map Just Changed.
Oil shocks, frozen rate cuts, and private-credit stress do not stay on trading desks. They move into household budgets, small-business margins, rent rolls, credit card balances, and dividend payout risk. That is why DIVIDOND now puts RISK, VETTED macro, and Real Estate Edge on the top line.
The March 19 VETTED note framed the problem bluntly: the Fed may be frozen, but your balance sheet is not. Higher gas, diesel, credit-card rates, and delayed rate cuts change the hurdle rate for every investment decision. For dividend investors, that means the first question is not "what yields the most?" It is "what can keep paying if the macro backdrop stays expensive?"
SubscribeSubscribers get the sharper read: which income themes deserve patience, which yields are compensation for real risk, and when real estate belongs beside public dividend exposure rather than replacing it. Start with the full VETTED note, then compare your risk behavior before you size the trade.
Past Issues, In Full
The Diversification Speech
June 5, 2026 - written mid-session, with the market still open.
Your advisor told you to diversify. So you own large cap, mid cap, small cap, international, emerging markets, REITs, and a bond ladder. On the day this was written they all went down together. Diversification across correlated assets isn't diversification. It's the illusion of safety sold by people who charge basis points to construct it.
When someone is forced to sell, they don't sell what they want to sell. They sell what they can - whatever has a bid. That's why gold, crude, bitcoin, bonds, and small-cap funds all turned red on the same candle: they weren't falling because their stories changed, they were falling because they were collateral in someone else's margin call. The yen sitting past 160 against the dollar was the engine - the carry-trade unwind that forces the machines to cut every exposure at once.
The tell was real estate. Residential and core REITs stayed green while the leveraged growth complex lost a fifth of its value - the difference between owning a financing structure and owning an actual cash-flowing asset. On a day when the machines delever everything liquid, a building that mails you a rent check doesn't care what the yen did. Consumer staples, healthcare, utilities, and the high-dividend ETF SCHD held or paid while SOXL fell eighteen percent and paid nothing. One is an income asset; the other is a lottery ticket with a ticker. That's the whole lesson, and it's the reason DIVIDOND leads with income, defensives, cash, and direct real estate cash flow.
Full detail and the live cross-market read are part of the DIVIDOND subscriber work.
May Views: Pure Yield vs Double the Income
From a 50-name list narrowed to May and June dividend dates, two setups stood above the rest for two different reasons. PRU was the clean pure-yield choice. TROW was the stronger double-income candidate for a dividend-plus-covered-call approach - the exact template Bucket A and Bucket B build on this month.
The pure yield pick: PRU (Prudential Financial). At a 6.0% yield with a 54.7% payout ratio, PRU stood out for current income paired with principal stability. Its 9.4x P/E kept it among the cheapest credible options on the shortlist, and insurance cash flows tend to hold up better than many cyclicals when markets tighten.
The double-income pick: TROW (T. Rowe Price). TROW offered the cleaner business quality for layering a covered call on top of the dividend - a 30% operating margin, a 56% payout, and a liquid options market supported by a $21.7B market cap and heavy institutional ownership. With elevated implied volatility, an out-of-the-money call could add premium on top of the dividend stream, balancing call income, dividend income, and capped upside. The one operational detail that decides it: the ex-dividend date, since deep in-the-money calls can be assigned early.
MAR 2026: The Price Is WRONG!
The market was flashing contradictions. Public credit spreads sat near historic lows - investment-grade around 70 basis points, high-yield at 90 - signaling calm. But behind the walls of the private credit market, where loans are self-valued and exit doors are narrow, a very different story was developing.
"When public markets show calm and private lenders are getting pummeled, that mismatch is the signal."
Around $47 billion in tech loans were trading at distressed levels - $18 billion of that moved into distress in a single month - and the Fed flagged "vulnerabilities associated with the private credit sector." The lesson for dividend investors was not to flee private assets but to know what you own. Dividend investors who anchor to cash-generating businesses with transparent balance sheets are better positioned than those chasing yield in opaque structures.
RISK Profile
Before yield, define capacity, need, tolerance, and behavior. A dividend portfolio should be sized for the investor you actually are in a drawdown.
Take the assessmentVETTED Macro
Oil shocks, frozen rate cuts, and consumer debt pressure all land in portfolios. The VETTED note connects the macro headline to household and business cash flow.
Read the VETTED noteReal Estate Edge
REITs are only one path to property income. For direct property views, model-driven underwriting, and local cash-flow thinking, go deeper at RealFiModel.
See property views