Strategy · Income · Clarity

Dividends don't lie.

In a market of noise, cash flow is the only signal that matters. Explore insights, strategies, and a curated portfolio for the modern income investor.

View Model Portfolio
Cover Story · 4 Min Read

MAR 2026: The Price Is WRONG!

The market is flashing contradictions. Public credit spreads sit near historic lows — investment-grade at roughly 70 basis points, high-yield at 90 — signaling calm. But behind the walls of the private credit market, where loans are self-valued and exit doors are narrow, a very different story is developing.

"When public markets show calm and private lenders are getting pummeled, that mismatch is the signal."

Welcome to March 2026, where the price on the surface is wrong. Around $47 billion in tech loans now trade at distressed levels — $18 billion of that moved into distress in a single month. The Federal Reserve flagged it in January meeting minutes, noting "vulnerabilities associated with the private credit sector." And yet spreads haven't budged. That gap between what's visible and what's real is exactly where dividend investors need to stay focused.

THE MACRO PICTURE

The $3 trillion private credit market grew fast during the cheap-money era, taking up slack from banks that retreated from corporate lending. Much of that capital flowed into software LBOs and AI data center buildouts — sectors now under pressure from AI disruption fears and rising rates. The core danger: these are illiquid, self-valued loans. Problems don't surface until they suddenly do.

A major private credit firm's move to sell $1.4 billion in loans at 99.7 cents on the dollar and halt quarterly redemptions in one fund sent shockwaves through the retail investor community — even though the firm positioned it as routine wind-down activity. The stock fell. Contagion fears spread to peers, with one competitor dropping nearly 8% in a single week. Emergency calls with financial advisers followed. Reactions split: some investors redeemed; others doubled down.

EYE ON ILLIQUIDITY RISK

The lesson for dividend investors is not necessarily to flee private assets — it's to know what you own. Thirteen percent of the loans in the sold portfolio were in software, a sector rattled by AI disruption fears. The Fed is watching. The current private credit stress has drawn comparisons to the August 2007 BNP Paribas fund freeze — a canary-in-the-coalmine moment that preceded the 2008 financial crisis by a full year. Whether this is the same movie or just a similar scene remains to be seen. Dividend investors who anchor to cash-generating businesses with transparent balance sheets are better positioned than those chasing yield in opaque structures.

March 2026 · Dividend Screen

Ticker Spotlight

MAR 2026
High Dividend Payers
Coverage
20+ tickers
Ex-Date Range
Mar 2–31 ’26
Use
Idea starter
Dividend figures can change. Confirm ex-dates and amounts with primary sources before making decisions.
MDLZ
Mondelez International
Sector
Food-Confectionery
Ex-Date
Mar 31 ’26
Dividend
$2.00
Div Yield
3.3%
Payout Ratio
102.4%
Screen highlight — verify payout details before acting.
USB
U.S. Bancorp
Sector
Super-Regional Banks
Ex-Date
Mar 31 ’26
Dividend
$2.08
Div Yield
3.7%
Payout Ratio
44.45%
Screen highlight — verify payout details before acting.
NTR
Nutrien Ltd.
Sector
Agricultural Chemicals
Ex-Date
Mar 31 ’26
Dividend
$2.20
Div Yield
3.3%
Payout Ratio
35.16%
Screen highlight — verify payout details before acting.
TTE
TotalEnergies SE
Sector
Oil Comp-Integrated
Ex-Date
Mar 31 ’26
Dividend
$4.3754
Div Yield
5.5%
Payout Ratio
17.79%
Screen highlight — verify payout details before acting.
TRP
TC Energy
Sector
Pipelines
Ex-Date
Mar 31 ’26
Dividend
$2.5756
Div Yield
0.6406%
Payout Ratio
97.92%
Screen highlight — verify payout details before acting.
MO
Altria Group
Sector
Tobacco
Ex-Date
Mar 25 ’26
Dividend
$4.24
Div Yield
1.06%
Payout Ratio
75.53%
Screen highlight — verify payout details before acting.
SRE
Sempra
Sector
Electric-Distribution
Ex-Date
Mar 26 ’26
Dividend
$2.58
Div Yield
0.645%
Payout Ratio
78.47%
Screen highlight — verify payout details before acting.
PBA
Pembina Pipeline
Sector
Pipelines
Ex-Date
Mar 16 ’26
Dividend
$2.0408
Div Yield
0.5102%
Payout Ratio
99.82%
Screen highlight — verify payout details before acting.
DTE
DTE Energy
Sector
Electric-Integrated
Ex-Date
Mar 16 ’26
Dividend
$4.66
Div Yield
1.165%
Payout Ratio
62.44%
Screen highlight — verify payout details before acting.
WMB
Williams Companies
Sector
Pipelines
Ex-Date
Mar 13 ’26
Dividend
$2.10
Div Yield
0.525%
Payout Ratio
70.06%
Screen highlight — verify payout details before acting.
AU
AngloGold Ashanti
Sector
Gold Mining
Ex-Date
Mar 13 ’26
Dividend
$2.249
Div Yield
1.73%
Payout Ratio
68.26%
Screen highlight — verify payout details before acting.
XEL
Xcel Energy
Sector
Electric-Integrated
Ex-Date
Mar 13 ’26
Dividend
$2.28
Div Yield
0.57%
Payout Ratio
49.65%
Screen highlight — verify payout details before acting.
EVRG
Evergy Inc.
Sector
Electric-Integrated
Ex-Date
Mar 10 ’26
Dividend
$2.78
Div Yield
0.695%
Payout Ratio
72.56%
Screen highlight — verify payout details before acting.
CHRW
C.H. Robinson
Sector
Transport-Services
Ex-Date
Mar 6 ’26
Dividend
$2.52
Div Yield
0.63%
Payout Ratio
51.49%
Screen highlight — verify payout details before acting.
ES
Eversource Energy
Sector
Electric-Distribution
Ex-Date
Mar 5 ’26
Dividend
$3.15
Div Yield
0.7875%
Payout Ratio
65.97%
Screen highlight — verify payout details before acting.
NTRS
Northern Trust
Sector
Fiduciary Banks
Ex-Date
Mar 6 ’26
Dividend
$3.20
Div Yield
0.80%
Payout Ratio
26.72%
Screen highlight — verify payout details before acting.
NE
Noble Corp.
Sector
Oil & Gas Drilling
Ex-Date
Mar 4 ’26
Dividend
$2.00
Div Yield
0.50%
Payout Ratio
148.2%
Screen highlight — verify payout details before acting.
DINO
HF Sinclair
Sector
Oil Refining & Marketing
Ex-Date
Mar 2 ’26
Dividend
$2.00
Div Yield
0.50%
Payout Ratio
97.86%
Screen highlight — verify payout details before acting.
HIG
Hartford Financial
Sector
Multi-line Insurance
Ex-Date
Mar 2 ’26
Dividend
$2.40
Div Yield
0.60%
Payout Ratio
15.62%
Screen highlight — verify payout details before acting.
Disclosure
Educational content only
Not advice
No investment / tax / legal advice
Always verify
Company filings & broker data
Use this carousel as a watchlist prompt, not a trade signal.
Tip: Hover (or focus) to pause. Use Prev/Next to scan manually.
Data · March 2026

Dividend Screen

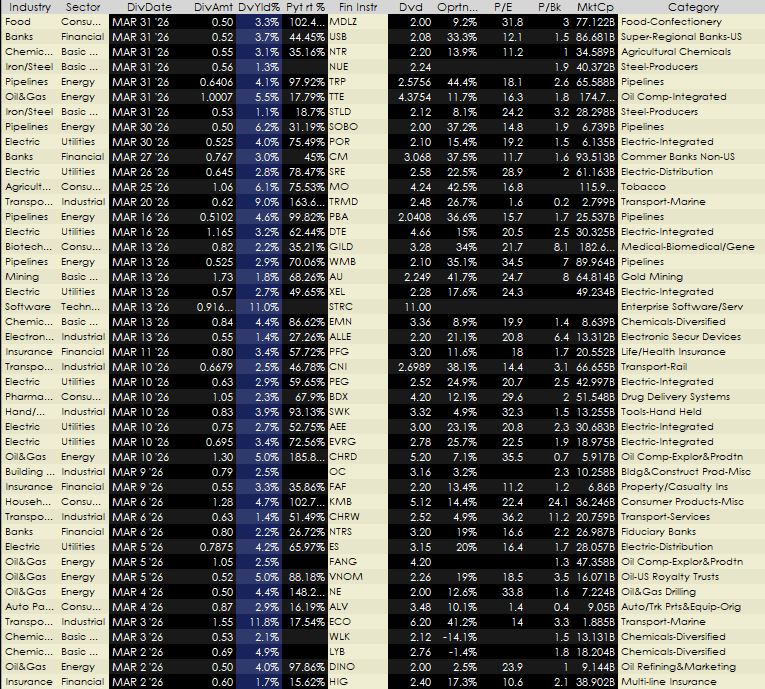
March 2026 Dividend Payers — screened for ex-dates between Mar 2–31 ’26. We used a consistent screener process to surface income candidates across sectors ./DIVIDEND_March26.png (updated 2/25/26).

March 2026 dividend screen with tickers, dividend dates, yields, payout ratios, P/E, P/B, and market cap.
March 2026 screen: tickers, sectors, ex-dates, yields, payout ratios, P/E, P/B, and market cap.

Video Analysis

We discuss the "Twilight Zone" market mechanics and how to avoid behavioral traps.

Model Dividend Portfolio

This model illustrates how an investor might allocate capital across sectors to balance yield and growth. Tailor this to your own risk tolerance.

Allocation Sector Role Target Yield
20%UtilitiesStability Anchor4.0%
20%HealthcareDefensive Growth2.5%
15%StaplesInflation Hedge3.0%
15%TechnologyDividend Growth1.5%
10%REITsIncome Booster5.0%
10%EnergyCash Flow6.0%
10%FinancialsCyclical Upside3.5%

Market Sentiment (UMCSI)

Why it matters: Inflation expectations are watched closely by the Fed. A jump in 1‑year expectations can push yields higher. Currently, sentiment suggests consumers are pulling back, which is historically bad for bonds but offers entry points for high-quality dividend payers.